| 关联规则 | 关联知识 | 关联工具 | 关联文档 | 关联抓包 |
| 参考1(官网) | |
| 参考2 | |
| 参考3 |
Acknowledgements
A huge thank you to the following individuals. Simply put, this research would not have been possible without their help and patience. They not only helped me understand multiple concepts but served as sanity checkers throughout the entire process. Again, thank you for your time and patience:
-
Jared Atkinson, SpecterOps
-
Lee Christensen, SpecterOps
This research was inspired by and would not be possible without the incredible work performed by the following individuals:
-
Matt Graeber, Red Canary
-
Will Schroeder, SpecterOps
-
Matt Hand, SpecterOps
-
James Forshaw, Google
Table of Contents
Why is it interesting from a defensive perspective?
Introduction
Jared Atkinson introduced the capability abstraction methodology in 2019 to build more robust detections using built-in (Windows Security Events) and commercial tooling (Various different EDR products). This process takes an attack technique, lists out the tools that can perform that attack, and then breaks down the layers of technology used under the hood. One of the most common things we (the detection team at SpecterOps) have identified as we’ve repeated this process is that many attack techniques involve an interprocess communication (IPC) mechanism, specifically Remote Procedure Calls (RPC), but we didn’t see a lot of telemetry capabilities into this technology at first. That was not because there was no telemetry to be offered, it was because we didn’t understand RPC technology to its full extent. Due to that issue, further investigation into possible telemetry was needed.
What is RPC?
RPC stands for remote procedure call and is a technology used for distributed client/server communications between programs. This technology allows applications to send signals to each other to perform an operation. RPC is used for everyday procedures that happen within Windows environments ranging from authentication, service creation, directory replication, and more. However, I found that before I can understand how adversaries might manipulate this technology to perform malicious behavior, I had to understand how the technology and its mechanisms work.
Within this write-up, I will analyze components of Microsoft RPC (MSRPC) implementation and its supporting development tools. I will go over various ways security researchers and Windows applications can interact with Windows RPC servers, but this research will not cover the low-level protocol implementation details (see impacket or NtObjectManager for details about that).
Components
-
RPC Protocol
-
RPC Client/Server
-
RPC Interface
-
RPC method
-
Client/Server stubs
-
NDR Engine/Marshalling
-
RPC Run-Time
-
RPC endpoint mapper
-
Endpoint
-
Name Service Database
RPC Protocol
The RPC protocol provides a method of inter-process communication between a server and client applications. RPC provides an application developer a generic way to execute a procedure (a.k.a. a function) in a local or remote process without having to understand the network protocols used to support the communication. RPC protocols can be used to either facilitate communications from one host to another (DCOM RPC) or it can be used to facilitate communications, as well as carry out the instructions for that communications. In Window environments, RPC commonly works over the network via named pipes and TCP/IP and locally via advanced local procedure calls (ALPC). For the purposes of this paper, I will only be discussing the most common protocols in which RPC occurs over: named pipes and TCP/IP. For more information about ALPC, see Clément Rouault and Thomas Imbert talk covering the subject (https://pacsec.jp/psj17/PSJ2017_Rouault_Imbert_alpc_rpc_pacsec.pdf).
Microsoft supports “service based” protocols by default on Windows. These protocols are services that Microsoft has defined. They are built out for various functionalities, like printer capabilities, directory replication, service creation and more. Many of these protocols use RPC to act as the facilitator and the fulfiller of the communications. Examples of common service-based RPC protocols are:
-
Service Creation (MS-SCMR)
-
Directory Replication Service (MS-DRSR)
-
Remote Registry (MS-RRP)
-
Scheduled Task (MS-SCMR)
-
Print System (MS-RPRN)
-
Windows Management Instrumentation (MS-WMI)
In order to understand the various components within RPC, defining what an RPC clientserver is and what it can be is required. Within some of the sections below, I will add screenshots of a custom RPC clientserver application I built out utilizing the Microsoft Interface Definition Language (MIDL – this concept is described more in depth with the upcoming sections) format supplied by Microsoft. This is meant to add context around some of the sections. If anyone would like to go through the process of building out their own applications as well, a good walk-through can be found here:
https://www.codeproject.com/Articles/4837/Introduction-to-RPC-Part-1#Implicitandexplicithandles17
RPC Client/Server
All the code needed to interact with a Microsoft supported RPC Protocol is pre-compiled and stored within the RPC server. Microsoft did this so that developers did not have to write the code needed to interact with all MSRPC interfaces without needing to implement the calls at a protocol level. RPC server is not an application. It is code that holds the definitions for the RPC interface GUID, transport protocols (e.g. named pipes or TCP/IP), methods, and method parameters needed to complete the RPC communication, assuming the client is coded correctly (this will be explained more in the following sections).
The RPC server can live within DLL, EXE, or SYS binaries, but these applications are not the application itself. For example, if the RPC server code is stored within services.exe, services.exe is not the RPC server. Services.exe contains the server code. It is stored within the applications code, but not the application itself.
In order for RPC communication to be initiated, the RPC server must be started, its functions exposed to the RPC Runtime, and actively listening for connections. Then the client exposes its functionalities to the RPC Runtime, connects to the server by specifying the UUID (universally unique identifier) of the interface, and begins communicating with the server. Remember, the clientserver code is typically embedded within an application, but the application is not always the RPC client or RPC server.”
RPC Interface
When using Microsoft’s development tools, an RPC interface is defined by the Microsoft Interface Definition Language (MIDL). MIDL includes what protocol the interface is associated with, the methods, and their parameters that interact with the interface. Each interface is tied to a universally unique identifier (UUID) that is 128 bits or 16 bytes.
Below is an example of an IDL file that is defining the RPC interface:
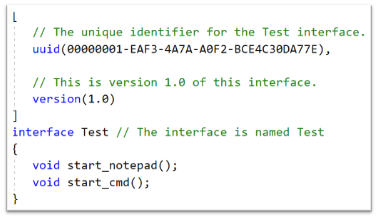
The above shows the UUID of the interface that is being exposed, the interface name (Test), along with the different methods (methods are defined in the next section) that can be invoked while interacting with this interface.
The interface can be thought of as the bridge between the RPC client and server. The RPC client must implement the interface, and the RCP server must expose the same exact interface otherwise communication will not occur.
Some of the ways a client can connect to the server are as follows:
-
An RPC client code calls a Win32 API that will implement an RPC interface. This can be seen inside of native Windows binaries.
-
An RPC client contains the necessary IDL (Interface Definition Language) code baked in so that it can talk to the RPC server. An example of this can be found within Mimikatz code.
-
An RPC client will talk to the RPC server directly by implementing the RPC over TCP/IP or RPC over named pipe protocols and will not interface with the client’s OS’s RPC runtime. This is seen within Impacket, where the all the client-side components needed to successfully communicate to the RPC server are handcrafted. This will include hand crafting the client stub for serialization, code needed to fit the NDR (Network Data Representation) format, RPC method code, RPC handle binding, etc.
RPC Method
Methods are functions that the RPC server exposes to perform a specific behavior. When these methods are called, they accept parameters and arguments, perform the task, then return data/results back to the client. Each RPC method is identified by an OpNum. OpNum’s are given to a method based on where they are defined within the Server code. For example, below shows two different methods (start_notepad and start_cmd) within the server code:
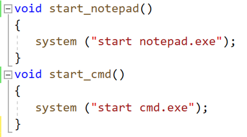
As shown above, the server code will define each function. In this instance, start_notepad would correlate with OpNum #0, where start_cmd will correlate with OpNum #1.
Identifying the OpNum is useful to understand the correlating the method during the analysis of RPC communications and we can then answer the following:
-
Why the method was invoked?
-
What are the behavioral actions that occurred from the RPC communication?
Client/Server Stubs
Stubs are used to serialize/deserialize the parameters being passed to the method, as well as interface with Windows’s RPC runtime to send/receive data over a transport. When the client wants to use a method, it will pass the parameters needed for that method to perform the specific task. The parameters need to be transported to the server application. Before the transport of these parameters can happen, the client stub must serialize the parameters. The server will deserialize or “unpack” the parameters before feeding it to the exposed method function that is being invoked.
The following image shows an example of what the client stub may look like, however note that in this code no parameters are being passed to the methods:
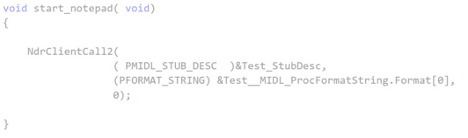
The client stub converts the parameters being passed to the method into an NDR format, which must be used so that the NDR engine (explained in next section) can transport the serialized data to the [RPC] server application. Once the server stub retrieves the parameters, it will deserialize the data from NDR to the format the server needs.
NDR Engine
The Network Data Representation engine is responsible for the marshalling of DCOM & RPC components. Once the client stub serializes the method’s parameters, that data must get to the server stub somehow. This transportation is done through the runtime which is driven by the NDR engine.
RPC Runtime
The RPC runtime holds the operating system’s core RPC services, such as the endpoint mapper. The RPC runtime is also responsible for the transportation of the serialized parameters from the client stub to the server stub. The RPC Runtime code can be found in the Rpcrt4.dll binary.
RPC Endpoint Mapper
The endpoint mapper is a service that is located on every Windows host and can be seen as epmapper. This service maintains the database of endpoints that clients use to map an interface to endpoints. At runtime, this service is started and acts a director to map client/server communication.
Name Service Database (Locator)
The Name Service Database allows client applications to use a logical name instead of a specific network address/protocol sequence. Microsoft identifies that this can be seen with some printer RPC communications, but personally I haven’t seen this. Based on this article, it seems that this service is not supported on Windows Vista and later.
Endpoint
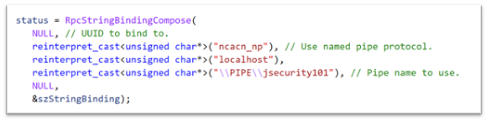
An endpoint is the TCP/IP port (ncacn_ip_tcp), or named pipe (ncacn_np), that the client will use to communicate with the server. The server will listen on this endpoint and wait for the client to initialize the communication. There are two types of port endpoints - static and dynamic. Static endpoints are used when an RPC Protocol will communicate over the same port/named pipe every time. A dynamic endpoint will be used when a range of ports are utilized, or if the protocol allows connection over ncacn_ip_tcp and ncacn_np.
The clientserver code below shows an example of a static endpoint being implemented so that the two applications can successfully connect:
Client:
Server:
COM & RPC
The Component Object Model (COM) is a standard used by software developers to interact with operating system components in different languages without needing to reimplement client interfaces. This technology allows objects to interact across processes and computer boundaries. Generally speaking,
-
Interaction between COM objects on a local host is known commonly as “COM”
-
Interaction between COM objects between two remote hosts is commonly known as Distributed COM (DCOM).
DCOM uses Microsoft’s RPC framework. COM/DCOM sits at a layer above RPC. RPC is used to marshal the interaction requests, where DCOM is used to fulfill the interaction requests.
Although this paper will not cover COM/DCOM components, it is good to recognize that these two technologies do work together.
RPC Process
-
A process loads an RPC server and registers it with the RPC runtime
-
Client code implements an RPC interface.
-
Parameters are defined for the method that the client wants to invoke.
-
Parameters are serialized via client stub in an NDR format.
-
The NDR engine will drive the RPC runtime, which transports the serialized data to the server applications.
-
Endpoint will be determined by interface.
-
Mapped either by the RPC Name Service Database (which allows client applications to use a logical name instead of a specific network address/protocol sequence) OR RPC Endpoint Mapper (which will utilize endpoints (ports/named pipes) instead of logical names).
-
Remote machine’s RPC runtime accepts the incoming communication and passes the serialized data to the RPC server stub.
-
Once communication a Bind is created to the context handle to allow the connection to stay persistent until client is done sending requests.
-
Server stub will deserializes the parameters.
-
Parameters are passed to the method.
-
Methods are invoked.
-
If there is a reply, server stub serializes the outgoing information and transmits it back through the runtime.
Note: Again, RPC servers code can be stored in either a DLL, EXE, or SYS binaries. Server binaries are loaded into the runtime prior to the client making the connection request. A request can’t be accepted if the server isn’t loaded within the runtime. A lot of server code is loaded on boot (lsass.exe, services.exe, etc)
Why is it interesting from a defensive perspective?
As discussed above, an attacker can implement an RPC Interface one of the following ways:
-
An RPC client code calls a Win32 API that will implement an RPC interface. This can be seen inside of native Windows binaries typically.
-
An RPC client contains the necessary IDL (Interface Definition Language) code baked in so that it can talk to the RPC server. An example of this can be found within Mimikatz code.
-
An RPC client will talk to the RPC server directly by implementing the RPC over TCP/IP or RPC over named pipe protocols and will not interface with the client’s OS’s RPC runtime. This is seen within Impacket, where the all the client-side components needed to successfully communicate to the RPC server is handcrafted. This will include hand crafting the client stub for serialization, code needed to fit the NDR format, RPC method code, RPC handle binding, etc.
This gives an attacker multiple avenues to communicate with the RPC Server. However, due to the technology set in place, they can’t control the RPC Server (given they are trying to connect to a Microsoft supported RPC server). Documenting different RPC servers holds value for defenders. Matt Nelson has documented RPC servers inside of this GitHub Gist.
Identifying the RPC Servers
In a previous blog post - Utilizing RPC Telemetry, Jared Atkinson, Luke Paine, and myself briefly walk through how to identify an RPC Server using Capability Abstraction and utilize the telemetry that correlates with it to create an effective detection. In this blogpost we didn’t go over the specifics on how we captured each section of that data for research, then correlated the research data with actual telemetry that can be used in scale. That was done on purpose, as it went beyond the scope of that post. Below will be a detailed walk through on how we can identify an RPC Server, see the communication between client and server, and the methods being invoked. After that, we will correlate the research data, with data that we have found can be used in real world environments for telemetry.
For this paper, the following attacks will be looked at to help show RPC’s technology and how defenders may use the correlating telemetry to find malicious activity - DCSync and Remote Service Creation. I chose these two use cases because one attack holds the RPC server code in a DLL, the other in an EXE. Also, these attacks are well known, so going in depth about how these attacks work won’t be necessary as there are plenty of great posts out on both subjects.
DCSync TL;DR
DCSync is a technique used to capture credentials by impersonating a Domain Controller. When this is done the attacker is taking advantage of domain replication via the Directory Replication Service RPC Protocol (MS-DRSR). The interface specific for this attack will be DRSUAPI. The attacker must obtain a user with high privileged rights. Typically, these rights are given by default to the Domain Administrators, Enterprise Administrators group, or DC computer accounts but this doesn’t have to be the case. The attacker needs the extended rights:
-
DS-Replication-Get-Changes-All (GUID - 1131f6ad-9c07-11d1-f79f-00c04fc2dcd2)
-
DS-Replication-Get-Changes (GUID - 1131f6aa-9c07-11d1-f79f-00c04fc2dcd2)
These extended rights are needed to access the Domain-DNS Class object. Once access to this object is successfully acquired, replication to the NC replica with AD can be achieved via IDL_DRSGetNCChanges function.
The process to perform this attack is as follows:
-
Attacker obtains user with the specified extended rights.
-
Targets a Domain Controller to replicate.
-
Requests the replication via IDL_DRSGetNCChanges.
-
Obtains AD secrets.
Remote Service Creation TL;DR
Creating a service is common by an attacker for:
-
Persistence
-
Privilege Escalation
-
Lateral movement.
I am going to focus on the lateral movement aspect of service creation. How an attacker can create a service on a remote host. This has been a common attack that has been identified when an attacker wants to move from one host to the other with SYSTEM level privileges. This can be achieved custom tooling that will interact with the API’s - CreateService/OpenSCManager or by interacting with the Registry (RegCreateKey, RegSetValue) within the HKLMSYSTEMCurrentControlSetServices\* key. Whichever way they decide to, the will all use the Service Control Manager Remote Protocol (MS-SMCR). There are plenty of native and non-native ways to create a service, the use case for the purpose of this paper is sc.exe.
Interface UUID Identification
With each of these attacks it has been identified that both utilize the RPC technology. As defined above, RPC interface will act as a bridge between the client and server code. However; how can these interfaces be identified for each of the use cases? Typically, this can be found within the IntroductionStandard Assignments section within the Microsoft Documentation that is defining each procedure.
MS-DRSR:
MS-SCMR:
Server Code Identification
Identifying where the RPC Server code is stored is going to be the next step. By identifying this, I know what to monitor for the rest of my testing. To do this I will be using a function inside of NtObjectManager by James Forshaw called “Get-RpcServer”.
PS > Install-Module NtObjectManager
PS > Import-Module NtObjectManager
After the module is installed and imported, I will set the $rpc variable to search across the C:WindowsSystem32\ directory and identify any RPC servers.
PS > $rpc = ls C:\Windows\System32\* |
Get-RpcServer -DbgHelpPath “C:\Tools\WindowsSDK\WindowsKits\10\Debuggers\x64\dbghelp.dll”
The DbgHelpPath flag will pull symbols for method names if they exist. In order to use this flag the WindowsSDK must be installed.
If I wanted to parse RPC Clients as well, I would need to add the -ParseClients flag at the end, like so:
PS > $rpc = ls C:\Windows\System32\\* | Get-RpcServer –ParseClients -DbgHelpPath “C:\Tools\WindowsSDK\WindowsKits\10\Debuggers\x64\dbghelp.dll”
This will store RPC Servers and Clients within the $rpc variable.
Next, I will identify where the Interface UUID is stored, which will give me the file path of the RPC Server.
MS-DRSR:
PS > $rpc | ? {($_.InterfaceId -eq 'e3514235-4b06-11d1-ab04-00c04fc2dcd2')} | Select FilePath
If I wanted to parse clients as well as servers (the second command above), then to show only the RPC Server the command would be this:
PS > $rpc | ? {($_.Client -eq $False) -and ($_.InterfaceId -eq 'e3514235-4b06-11d1-ab04-00c04fc2dcd2')} | Select FilePath

As it can be seen above, the server code that gets exposed to the runtime is ntdsai.dll. These commands have to be ran on the Domain Controller because Domain Controllers are the only systems where ntdsai.dll is stored.
MS-SCMR:
PS > $rpc | ? {($_.InterfaceId -eq '367ABB81-9844-35F1-AD32-98F038001003')} | Select FilePath

As it can be seen above, the server code that gets exposed to the runtime is services.exe.
Server Endpoint Identification
Now that I have identified where the RPC Server code is stored, I want to find the endpoints that are used to connect the client to the server via interface. To do this we can explore the Transport on the protocol page. This is stored in different sections on the Protocol page.
MS-DRSR:
Here we can see that the RPC transport for this protocol is done over TCP. There is no static port or named pipe being used, but this is identified at runtime. The Endpoint Mapper will identify the dynamic endpoint that was prescribed to the server when the client request communication.
MS-SCMR:
The above might be showing the communication can happen three ways, but reality this interface can be implemented one of two ways:
-
A SMB named pipe (PIPEsvcctl)
-
TCP
Method Identification
So far, the interfaces that two separate RPC protocols, where the server code is stored for these protocols, and the endpoints that the interfaces use have all been identified. The next thing I want to do is set up the monitoring capabilities needed to see what method calls and verify the endpoints that are utilized when a client initiates a request to perform either a service creation or DCSync. To see this, I will:
-
Set up Event Tracing for Windows (ETW) captures on the remote host to see the method and endpoint information.
-
Capture ProcMon data on both the local and remote host to show the endpoint and server/client information.
-
Utilize Wireshark on the remote host to see the network data surrounding the communications.
The installation of third-party tools will not be demonstrated, nor the capturing process. The captures will be shown to show what the result should look like. The ETW walkthrough can be found in this blog – Utilizing RPC Telemetry.
MS-DRSR:
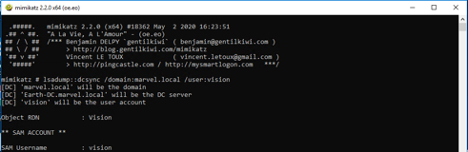
The DCSync attack was executed via Mimikatz, utilizing a Domain Admin account (Thor). The command looks like the following:
lsadump::dcsync /domain:marvel.local /user:vision
ETW Capture:
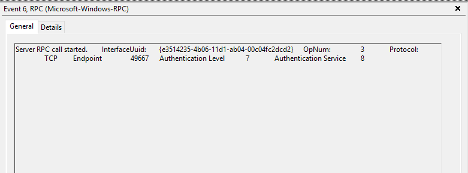
Highlights of what this data is identifying:
-
RPC server call with the interface UUID of - e3514235-4b06-11d1-ab04-00c04fc2dcd2
-
The protocol was TCP
-
The Endpoint was 49667
-
OpNum (Method) was #3. This correlates to IDL_DRSGetNCChanges. This OpNum can be correlated with the Microsoft Documentation to find its corresponding method:
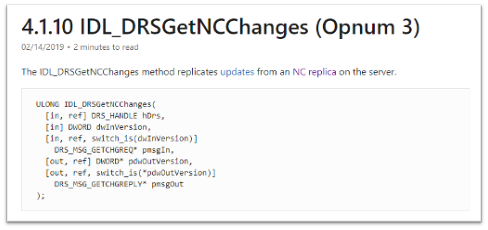
This context helps verify the information that was read on this protocol’s documentation pertaining the endpoint mapping. One thing to note is that this isn’t a static port. This port can be excluded in the firewall and then the endpoint mapping service will choose another port to talk to the server.
ProcMon Capture:
Client:
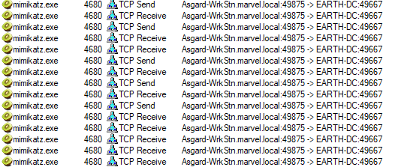
This data is fairly straight forward. It is identifying that the client is starting this RPC call, reaching out to the Domain Controller, EARTH-DC, on port 49875. That port then gets mapped to 49667 via Endpoint Mapper service.
I want to see the acceptance of this communication on the server side.
Server:
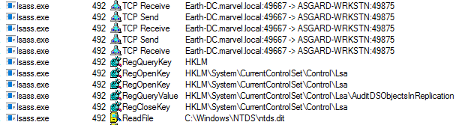 Above it can be see that LSASS is accepting the communication from ASGARD-WRKSTN, where the client initiated the connection request. Why is this the case if it has been identified that ntdsai.dll holds the RPC server code for the DRSUAPI interface? Through some testing I found that the LSASS process on Domain Controllers will load ntdsai.dll into the runtime. Since this is the case, it could be said that LSASS holds the server application hosting the server code via ntdsai.dll for this interface and when a client wants to communicate with this interface, LSASS will accept that request.
Note: LSASS holds RPC server code for multiple different interfaces. LSASS is hosting the code by loading the DLL which implements the server, ntdsai.dll. This can be seen below by showing the time between Sysmon Event ID 7 (ImageLoad) and the machines boot time:
Above it can be see that LSASS is accepting the communication from ASGARD-WRKSTN, where the client initiated the connection request. Why is this the case if it has been identified that ntdsai.dll holds the RPC server code for the DRSUAPI interface? Through some testing I found that the LSASS process on Domain Controllers will load ntdsai.dll into the runtime. Since this is the case, it could be said that LSASS holds the server application hosting the server code via ntdsai.dll for this interface and when a client wants to communicate with this interface, LSASS will accept that request.
Note: LSASS holds RPC server code for multiple different interfaces. LSASS is hosting the code by loading the DLL which implements the server, ntdsai.dll. This can be seen below by showing the time between Sysmon Event ID 7 (ImageLoad) and the machines boot time:
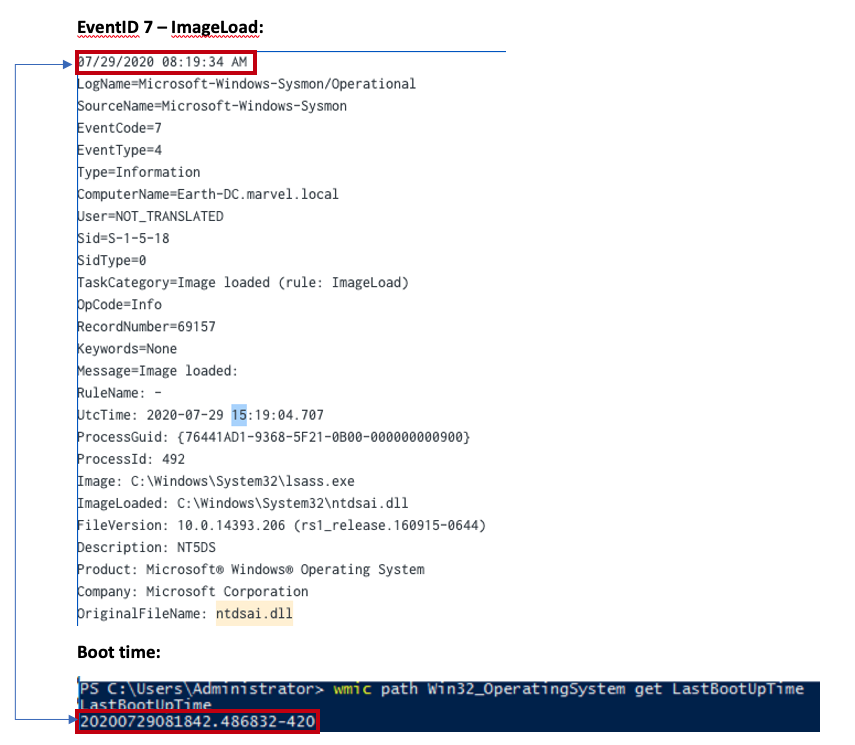
Above it can be seen that NTDSAI is loaded into LSASS within less than a minute of when the machine was started, meaning the server code associated with the DRSUAPI interface was loaded to the runtime at boot.
Through this testing, I have identified a process that could serve as a pivot in a detection in the future. It is also seen that after LSASS accepts the call, it reads the NTDS.dit file. This is where secrets, such as NTLM password hashes, are stored for the domain. After this is done, the data is sent back over the wire to the client. The next thing to identify and verify, are the methods that were used to obtain those secrets from NTDS.dit.
Wireshark Capture:
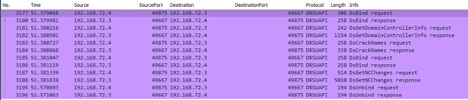
Highlights from this network capture:
-
Source IP/Port.
-
Destination IP/Port.
-
Protocol that was used for the communication between hosts. This correlates to the interface that was used for the communication because dynamic endpoints are implemented for this protocol.
-
Methods that were implemented.
MS-SCMR:
Service Creation was performed via sc.exe, utilizing a Domain Admin account (Thor). Service creation can be done by an Administrator or SYSTEM on a host. This test was conducted against a Domain Controller, hence why a DA account was used. The command looks like the following:
PS > sc.exe \\IP-Address-of-remote-host create test binpath=”C:\Windows\System32\notepad.exe”
ETW Capture:
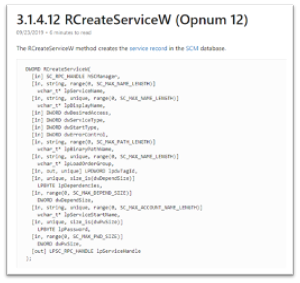
OpNum 12 – RCreateServiceW:
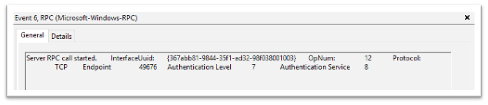
Highlights of what this data is identifying:
-
RPC server call with the interface UUID of - e3514235-4b06-11d1-ab04-00c04fc2dcd2
-
The protocol was TCP
-
The Port was 49676. ETW didn’t capture the pipe name of the endpoint used (PIPEsvcctl) and transformed the Port to the “Endpoint” section.
-
OpNum (Method) was #12. This correlates to RCreateServiceW. This OpNum can be correlated with the Microsoft Documentation to find its corresponding method:
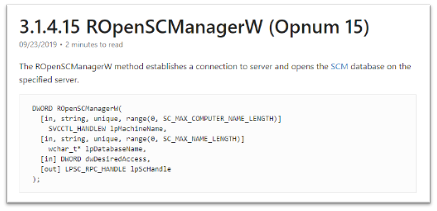
OpNum 15 – ROpenSCManagerW:
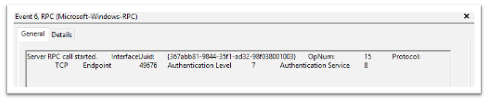
Highlights of what this data is identifying:
-
RPC server call with the interface UUID of - e3514235-4b06-11d1-ab04-00c04fc2dcd2
-
The protocol was TCP
-
The Port was 49676 – ETW didn’t capture the pipe name of the endpoint used (PIPEsvcctl) and transformed the Port to the “Endpoint” section.
-
OpNum (Method) was #12. This correlates to ROpenSCManagerW. This OpNum can be correlated with the Microsoft Documentation to find its corresponding method:
ProcMon Capture:
Client:
This capture is pretty straight forward. This is showing that sc.exe (native Windows binary) is sending TCP data to EARTH-DC via 49994, which the Endpoint Mapper service will redirect to 49676 so that the server will accept the communication.
Server:
On the server side I see that services.exe will accept the TCP request on port 49676. Once that is done, you can see that the service “test” was created with the Registry Key – HKLMSystemCurrentControlSetServicestest via RegCreateKey.
Wireshark Capture:
Highlights from this network capture:
-
Source IP/Port
-
Destination IP/Port
-
Protocol that was used for the communication between hosts. If you go back to the Server Transport page, I can see one of the endpoints was \PIPEsvcctl. This will directly correlate with the Protocol seen here.
-
Methods that were implemented
Purpose
The purpose of capturing this data in different ways was to verify each aspect of the RPC communication.
-
The client making the request (Found via Procmon).
-
The interface it is communicating with (Found via ETW & Wireshark).
-
The methods it is implementing (Found via ETW & Wireshark).
-
The endpoints that were being mapped to the server (Found via Procmon, ETW, Wireshark).
-
The server application that was accepting that communication (Found via Procmon).
The reason why two different use cases were shown, was because I wanted to show how different RPC servers vary with how they work and how they were similar. This was shown with the server code for SCMR being stored in services.exe, where for DRSR was stored in ntdsai.dll. The services.exe binary didn’t have to be loaded by another binary at boot to expose the server code it holds to the Windows Runtime; this was handled within the binary code. Whereas, ntdsai.dll had to be loaded by the lsass.exe binary first before its code was exposed to the Windows Runtime. However, similarities can be seen in how the interfaces, endpoints, and methods are handled.
Now that the research has been verified, I can take this research data and hopefully turn it into telemetry data, which is something I can use for detection/investigation purposes.
Research Data to Telemetry
Converting research data into telemetry can be relatively easy, depending on the data sensors within the environment. What does this mean? It means taking the data attributes I found during testing and converting them to a data sensor that could potentially use within a larger environment at scale.
The data I show below correlates directly to the RPC data shown within the research. I am aware there are multiple detections for these two behaviors, but this will follow a different methodology to see this activity. That isn’t to say past detections are bad, this is just extra visibility that I haven’t seen applied a lot to those previous detection efforts. The objective for this telemetry is - to identify when an RPC server was connected to, to perform an action I know could be malicious.
The data sensors below were used for telemetry testing:
-
Windows Security Events
-
Zeek
Note:All testing was done inside of a personal hunting lab setup that Ben Shell and I put together calledMarvel-Lab. This lab can be accessed, built out, and used by any user. This project holds all of the necessary components preconfigured and needed to test out this activity.
During the testing process, it was evident that one data sensor that could be used for telemetry was Zeek. Zeek allows insight into the interface being used, the source/destination ports and IP addresses, along with the method that was invoked. Here is a link that holds their DCE RPC configurations:
https://docs.zeek.org/en/current/scripts/base/protocols/dce-rpc/consts.zeek.html
After looking closely, it is clear that I could capture this data simply with this sensor. To verify, I checked within my Splunk instance:
MS-DRSR:
MS-SCMR:
These events show me data to everything, except the RPC server application that accepted the communication. When trying to find this, I ran across Event ID 5712 – A Remote Procedure Call Was Attempted. I tested this event and come to find out, it doesn’t log. It is unclear if this event was logged in the past, but currently the Microsoft Docs say this - “It appears that this event never occurs”:
Meaning that this event isn’t meant to actually capture anything, but where there is a will, there is a way. This goes back to “squeezing” the most out of the data sensors as possible. Even if an event doesn’t directly, or explicitly, correlate with a behavior, one might indirectly, or implicitly. There could be a technology built upon RPC that is being logged, that would give me the visibility needed to see this activity.
After some more digging, I was able to find an event that seem to generate every time I performed these events. 5156 – The Windows Filtering Platform has permitted a connection. Digging into the architecture, come to find out this technology is a network traffic process platform. I then found this mapping:
Within the “User Mode” section, I can see that this is built upon RPC and that it takes a huge role in this technology. After identifying that, I then saw that the RPC Server Application can be seen. This is exactly what I wanted. I was able to verify:
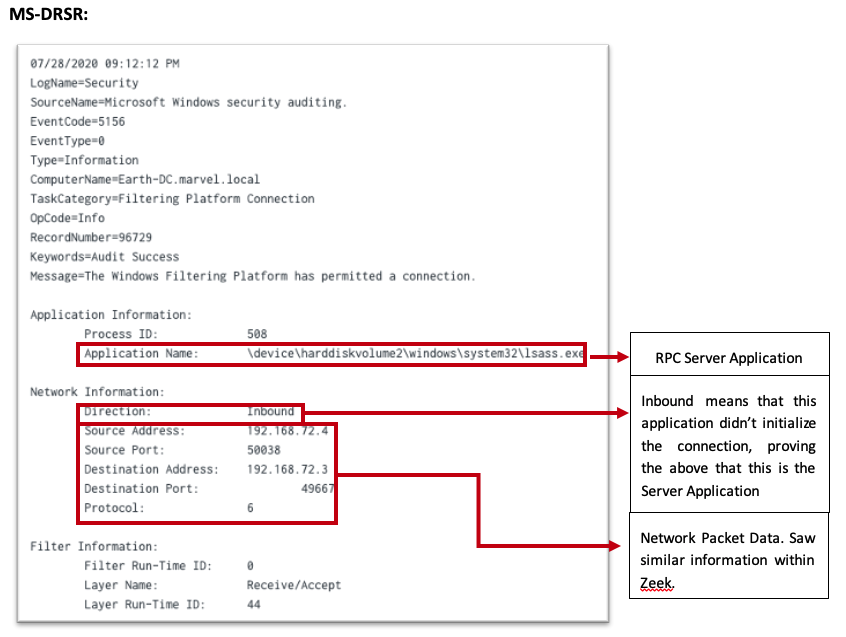
After identifying this, I tested and was able to make a correlation between these two data events (Windows Security Event 5156 & Zeek). Whichever data attribute one data sensor didn’t provide, the other was able to. This leads to the suspicion that this telemetry could be used at scale. This needed some testing.
Telemetry to Scalability
This information would be relatively useless unless there was a way was found to apply this knowledge at scale for Detection efforts. Within various client environments, I was unable to test the scalability of Event Code 5156. This event collects a lot of data and if you are using Splunk, it will eat your indexing limits. Some thoughts on how to apply this event at scale are as follows:
-
Identify the RPC Servers you want to start having visibility towards (i.e lsass.exe, services.exe)
-
Inside of the Splunk forwarder, apply this type of inclusions/exclusions that match those servers - https://www.hurricanelabs.com/splunk-tutorials/windows-event-log-filtering-design-in-splunk.
-
This would look similar to the following within the inputs.conf if the desire was to monitor for only services.exe (RPC server) for remote service creation –
-
When doing this, log for inbound connections as you are looking for the servers accepting the calls.
Note: Some exclusions might need to be applied to the ports/endpoints depending on Microsoft documentation and benign data. Exclusions might need to be applied to IP addresses. – For example, if monitoring lsass.exe for the DRSUAPI interface, exclude DC to DC communication.
-
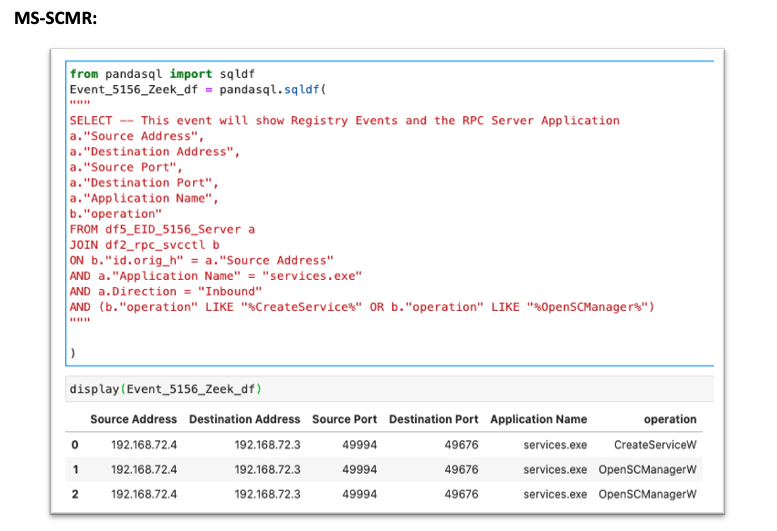
Collect RPC operation data from a network data source (Zeek for example), JOIN the 5156 to this event via Source/Destination Ports/Addresses, and specify the operation you are interested in. Examples using Jupyter Notebooks can be found below:
More advanced analytics pertaining to these two attacks can be found here -
MS-DRSR: https://github.com/specterops/ipc-research/blob/master/Analytics/DCSync.ipynb
MS-SCMR: https://github.com/specterops/ipc-research/blob/master/Analytics/Remote%20Service%20Creation.ipynb
I was able to identify via Palantir that using available EDR network data, there is similar data to the 5156. This could be used instead at scale JOIN’d with a Network Source to achieve the same goal. Thank you to Dane Stuckey and Palantir for looking into this.
Conclusion
As abstractions for attacks are continued to be created, the detection engineering team here at SpecterOps keep identifying various IPC mechanisms as one of the technologies being used within the attack. One of which that stood out was RPC. Due to the lack of information on the technology and what we thought was lack of data sources pertaining to its technology, I decided to dive into its inner workings to understand it at a deep level behavior.
While researching this topic, I knew that there had to be data that Detection Engineers could use to identify when RPC was used maliciously. In order to find this data understanding how RPC worked and understanding how attackers have and could use it to do their malicious behavior were both key factors. Identifying data sources that can be used to see the RPC server application and the RPC communication both, in research data and data at scale, were two goals that were resolved while doing this research.
Lastly, my hope is that this methodology can be adapted into your research process and its findings be collected as an area of possible telemetry for your environment.
I hope you enjoyed this research!
Acknowledgements
A huge thank you to the following individuals. Simply put, this research would not have been possible without their help and patience. They not only helped me understand multiple concepts but served as sanity checkers throughout the entire process. Again, thank you for your time and patience:
- Jared Atkinson, SpecterOps
- Lee Christensen, SpecterOps
This research was inspired by and would not be possible without the incredible work performed by the following individuals:
- Matt Graeber, Red Canary
- Will Schroeder, SpecterOps
- Matt Hand, SpecterOps
- James Forshaw, Google
Table of Contents
Why is it interesting from a defensive perspective?
Introduction
Jared Atkinson introduced the capability abstraction methodology in 2019 to build more robust detections using built-in (Windows Security Events) and commercial tooling (Various different EDR products). This process takes an attack technique, lists out the tools that can perform that attack, and then breaks down the layers of technology used under the hood. One of the most common things we (the detection team at SpecterOps) have identified as we’ve repeated this process is that many attack techniques involve an interprocess communication (IPC) mechanism, specifically Remote Procedure Calls (RPC), but we didn’t see a lot of telemetry capabilities into this technology at first. That was not because there was no telemetry to be offered, it was because we didn’t understand RPC technology to its full extent. Due to that issue, further investigation into possible telemetry was needed.
What is RPC?
RPC stands for remote procedure call and is a technology used for distributed client/server communications between programs. This technology allows applications to send signals to each other to perform an operation. RPC is used for everyday procedures that happen within Windows environments ranging from authentication, service creation, directory replication, and more. However, I found that before I can understand how adversaries might manipulate this technology to perform malicious behavior, I had to understand how the technology and its mechanisms work.
Within this write-up, I will analyze components of Microsoft RPC (MSRPC) implementation and its supporting development tools. I will go over various ways security researchers and Windows applications can interact with Windows RPC servers, but this research will not cover the low-level protocol implementation details (see impacket or NtObjectManager for details about that).
Components
- RPC Protocol
- RPC Client/Server
- RPC Interface
- RPC method
- Client/Server stubs
- NDR Engine/Marshalling
- RPC Run-Time
- RPC endpoint mapper
- Endpoint
- Name Service Database
RPC Protocol
The RPC protocol provides a method of inter-process communication between a server and client applications. RPC provides an application developer a generic way to execute a procedure (a.k.a. a function) in a local or remote process without having to understand the network protocols used to support the communication. RPC protocols can be used to either facilitate communications from one host to another (DCOM RPC) or it can be used to facilitate communications, as well as carry out the instructions for that communications. In Window environments, RPC commonly works over the network via named pipes and TCP/IP and locally via advanced local procedure calls (ALPC). For the purposes of this paper, I will only be discussing the most common protocols in which RPC occurs over: named pipes and TCP/IP. For more information about ALPC, see Clément Rouault and Thomas Imbert talk covering the subject (https://pacsec.jp/psj17/PSJ2017_Rouault_Imbert_alpc_rpc_pacsec.pdf).
Microsoft supports “service based” protocols by default on Windows. These protocols are services that Microsoft has defined. They are built out for various functionalities, like printer capabilities, directory replication, service creation and more. Many of these protocols use RPC to act as the facilitator and the fulfiller of the communications. Examples of common service-based RPC protocols are:
- Service Creation (MS-SCMR)
- Directory Replication Service (MS-DRSR)
- Remote Registry (MS-RRP)
- Scheduled Task (MS-SCMR)
- Print System (MS-RPRN)
- Windows Management Instrumentation (MS-WMI)
In order to understand the various components within RPC, defining what an RPC clientserver is and what it can be is required. Within some of the sections below, I will add screenshots of a custom RPC clientserver application I built out utilizing the Microsoft Interface Definition Language (MIDL – this concept is described more in depth with the upcoming sections) format supplied by Microsoft. This is meant to add context around some of the sections. If anyone would like to go through the process of building out their own applications as well, a good walk-through can be found here:
https://www.codeproject.com/Articles/4837/Introduction-to-RPC-Part-1#Implicitandexplicithandles17
RPC Client/Server
All the code needed to interact with a Microsoft supported RPC Protocol is pre-compiled and stored within the RPC server. Microsoft did this so that developers did not have to write the code needed to interact with all MSRPC interfaces without needing to implement the calls at a protocol level. RPC server is not an application. It is code that holds the definitions for the RPC interface GUID, transport protocols (e.g. named pipes or TCP/IP), methods, and method parameters needed to complete the RPC communication, assuming the client is coded correctly (this will be explained more in the following sections).
The RPC server can live within DLL, EXE, or SYS binaries, but these applications are not the application itself. For example, if the RPC server code is stored within services.exe, services.exe is not the RPC server. Services.exe contains the server code. It is stored within the applications code, but not the application itself.
In order for RPC communication to be initiated, the RPC server must be started, its functions exposed to the RPC Runtime, and actively listening for connections. Then the client exposes its functionalities to the RPC Runtime, connects to the server by specifying the UUID (universally unique identifier) of the interface, and begins communicating with the server. Remember, the clientserver code is typically embedded within an application, but the application is not always the RPC client or RPC server.”
RPC Interface
When using Microsoft’s development tools, an RPC interface is defined by the Microsoft Interface Definition Language (MIDL). MIDL includes what protocol the interface is associated with, the methods, and their parameters that interact with the interface. Each interface is tied to a universally unique identifier (UUID) that is 128 bits or 16 bytes.
Below is an example of an IDL file that is defining the RPC interface:
The above shows the UUID of the interface that is being exposed, the interface name (Test), along with the different methods (methods are defined in the next section) that can be invoked while interacting with this interface.
The interface can be thought of as the bridge between the RPC client and server. The RPC client must implement the interface, and the RCP server must expose the same exact interface otherwise communication will not occur.
Some of the ways a client can connect to the server are as follows:
- An RPC client code calls a Win32 API that will implement an RPC interface. This can be seen inside of native Windows binaries.
- An RPC client contains the necessary IDL (Interface Definition Language) code baked in so that it can talk to the RPC server. An example of this can be found within Mimikatz code.
- An RPC client will talk to the RPC server directly by implementing the RPC over TCP/IP or RPC over named pipe protocols and will not interface with the client’s OS’s RPC runtime. This is seen within Impacket, where the all the client-side components needed to successfully communicate to the RPC server are handcrafted. This will include hand crafting the client stub for serialization, code needed to fit the NDR (Network Data Representation) format, RPC method code, RPC handle binding, etc.
RPC Method
Methods are functions that the RPC server exposes to perform a specific behavior. When these methods are called, they accept parameters and arguments, perform the task, then return data/results back to the client. Each RPC method is identified by an OpNum. OpNum’s are given to a method based on where they are defined within the Server code. For example, below shows two different methods (start_notepad and start_cmd) within the server code:
As shown above, the server code will define each function. In this instance, start_notepad would correlate with OpNum #0, where start_cmd will correlate with OpNum #1.
Identifying the OpNum is useful to understand the correlating the method during the analysis of RPC communications and we can then answer the following:
- Why the method was invoked?
- What are the behavioral actions that occurred from the RPC communication?
Client/Server Stubs
Stubs are used to serialize/deserialize the parameters being passed to the method, as well as interface with Windows’s RPC runtime to send/receive data over a transport. When the client wants to use a method, it will pass the parameters needed for that method to perform the specific task. The parameters need to be transported to the server application. Before the transport of these parameters can happen, the client stub must serialize the parameters. The server will deserialize or “unpack” the parameters before feeding it to the exposed method function that is being invoked.
The following image shows an example of what the client stub may look like, however note that in this code no parameters are being passed to the methods:
The client stub converts the parameters being passed to the method into an NDR format, which must be used so that the NDR engine (explained in next section) can transport the serialized data to the [RPC] server application. Once the server stub retrieves the parameters, it will deserialize the data from NDR to the format the server needs.
NDR Engine
The Network Data Representation engine is responsible for the marshalling of DCOM & RPC components. Once the client stub serializes the method’s parameters, that data must get to the server stub somehow. This transportation is done through the runtime which is driven by the NDR engine.
RPC Runtime
The RPC runtime holds the operating system’s core RPC services, such as the endpoint mapper. The RPC runtime is also responsible for the transportation of the serialized parameters from the client stub to the server stub. The RPC Runtime code can be found in the Rpcrt4.dll binary.
RPC Endpoint Mapper
The endpoint mapper is a service that is located on every Windows host and can be seen as epmapper. This service maintains the database of endpoints that clients use to map an interface to endpoints. At runtime, this service is started and acts a director to map client/server communication.
Name Service Database (Locator)
The Name Service Database allows client applications to use a logical name instead of a specific network address/protocol sequence. Microsoft identifies that this can be seen with some printer RPC communications, but personally I haven’t seen this. Based on this article, it seems that this service is not supported on Windows Vista and later.
Endpoint
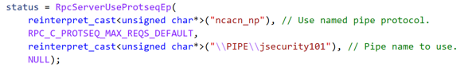
An endpoint is the TCP/IP port (ncacn_ip_tcp), or named pipe (ncacn_np), that the client will use to communicate with the server. The server will listen on this endpoint and wait for the client to initialize the communication. There are two types of port endpoints - static and dynamic. Static endpoints are used when an RPC Protocol will communicate over the same port/named pipe every time. A dynamic endpoint will be used when a range of ports are utilized, or if the protocol allows connection over ncacn_ip_tcp and ncacn_np.
The clientserver code below shows an example of a static endpoint being implemented so that the two applications can successfully connect:
Client:
Server:
COM & RPC
The Component Object Model (COM) is a standard used by software developers to interact with operating system components in different languages without needing to reimplement client interfaces. This technology allows objects to interact across processes and computer boundaries. Generally speaking,
- Interaction between COM objects on a local host is known commonly as “COM”
- Interaction between COM objects between two remote hosts is commonly known as Distributed COM (DCOM).
DCOM uses Microsoft’s RPC framework. COM/DCOM sits at a layer above RPC. RPC is used to marshal the interaction requests, where DCOM is used to fulfill the interaction requests.
Although this paper will not cover COM/DCOM components, it is good to recognize that these two technologies do work together.
RPC Process
- A process loads an RPC server and registers it with the RPC runtime
- Client code implements an RPC interface.
- Parameters are defined for the method that the client wants to invoke.
- Parameters are serialized via client stub in an NDR format.
-
The NDR engine will drive the RPC runtime, which transports the serialized data to the server applications.
- Endpoint will be determined by interface.
- Mapped either by the RPC Name Service Database (which allows client applications to use a logical name instead of a specific network address/protocol sequence) OR RPC Endpoint Mapper (which will utilize endpoints (ports/named pipes) instead of logical names).
-
Remote machine’s RPC runtime accepts the incoming communication and passes the serialized data to the RPC server stub.
- Once communication a Bind is created to the context handle to allow the connection to stay persistent until client is done sending requests.
- Server stub will deserializes the parameters.
- Parameters are passed to the method.
- Methods are invoked.
- If there is a reply, server stub serializes the outgoing information and transmits it back through the runtime.
Note: Again, RPC servers code can be stored in either a DLL, EXE, or SYS binaries. Server binaries are loaded into the runtime prior to the client making the connection request. A request can’t be accepted if the server isn’t loaded within the runtime. A lot of server code is loaded on boot (lsass.exe, services.exe, etc)
Why is it interesting from a defensive perspective?
As discussed above, an attacker can implement an RPC Interface one of the following ways:
- An RPC client code calls a Win32 API that will implement an RPC interface. This can be seen inside of native Windows binaries typically.
- An RPC client contains the necessary IDL (Interface Definition Language) code baked in so that it can talk to the RPC server. An example of this can be found within Mimikatz code.
- An RPC client will talk to the RPC server directly by implementing the RPC over TCP/IP or RPC over named pipe protocols and will not interface with the client’s OS’s RPC runtime. This is seen within Impacket, where the all the client-side components needed to successfully communicate to the RPC server is handcrafted. This will include hand crafting the client stub for serialization, code needed to fit the NDR format, RPC method code, RPC handle binding, etc.
This gives an attacker multiple avenues to communicate with the RPC Server. However, due to the technology set in place, they can’t control the RPC Server (given they are trying to connect to a Microsoft supported RPC server). Documenting different RPC servers holds value for defenders. Matt Nelson has documented RPC servers inside of this GitHub Gist.
Identifying the RPC Servers
In a previous blog post - Utilizing RPC Telemetry, Jared Atkinson, Luke Paine, and myself briefly walk through how to identify an RPC Server using Capability Abstraction and utilize the telemetry that correlates with it to create an effective detection. In this blogpost we didn’t go over the specifics on how we captured each section of that data for research, then correlated the research data with actual telemetry that can be used in scale. That was done on purpose, as it went beyond the scope of that post. Below will be a detailed walk through on how we can identify an RPC Server, see the communication between client and server, and the methods being invoked. After that, we will correlate the research data, with data that we have found can be used in real world environments for telemetry.
For this paper, the following attacks will be looked at to help show RPC’s technology and how defenders may use the correlating telemetry to find malicious activity - DCSync and Remote Service Creation. I chose these two use cases because one attack holds the RPC server code in a DLL, the other in an EXE. Also, these attacks are well known, so going in depth about how these attacks work won’t be necessary as there are plenty of great posts out on both subjects.
DCSync TL;DR
DCSync is a technique used to capture credentials by impersonating a Domain Controller. When this is done the attacker is taking advantage of domain replication via the Directory Replication Service RPC Protocol (MS-DRSR). The interface specific for this attack will be DRSUAPI. The attacker must obtain a user with high privileged rights. Typically, these rights are given by default to the Domain Administrators, Enterprise Administrators group, or DC computer accounts but this doesn’t have to be the case. The attacker needs the extended rights:
- DS-Replication-Get-Changes-All (GUID - 1131f6ad-9c07-11d1-f79f-00c04fc2dcd2)
- DS-Replication-Get-Changes (GUID - 1131f6aa-9c07-11d1-f79f-00c04fc2dcd2)
These extended rights are needed to access the Domain-DNS Class object. Once access to this object is successfully acquired, replication to the NC replica with AD can be achieved via IDL_DRSGetNCChanges function.
The process to perform this attack is as follows:
- Attacker obtains user with the specified extended rights.
- Targets a Domain Controller to replicate.
- Requests the replication via IDL_DRSGetNCChanges.
- Obtains AD secrets.
Remote Service Creation TL;DR
Creating a service is common by an attacker for:
- Persistence
- Privilege Escalation
- Lateral movement.
I am going to focus on the lateral movement aspect of service creation. How an attacker can create a service on a remote host. This has been a common attack that has been identified when an attacker wants to move from one host to the other with SYSTEM level privileges. This can be achieved custom tooling that will interact with the API’s - CreateService/OpenSCManager or by interacting with the Registry (RegCreateKey, RegSetValue) within the HKLMSYSTEMCurrentControlSetServices\* key. Whichever way they decide to, the will all use the Service Control Manager Remote Protocol (MS-SMCR). There are plenty of native and non-native ways to create a service, the use case for the purpose of this paper is sc.exe.
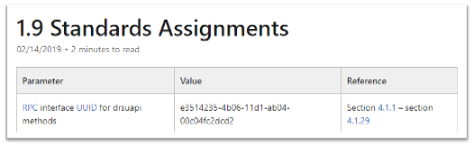
Interface UUID Identification
With each of these attacks it has been identified that both utilize the RPC technology. As defined above, RPC interface will act as a bridge between the client and server code. However; how can these interfaces be identified for each of the use cases? Typically, this can be found within the IntroductionStandard Assignments section within the Microsoft Documentation that is defining each procedure.
MS-DRSR:
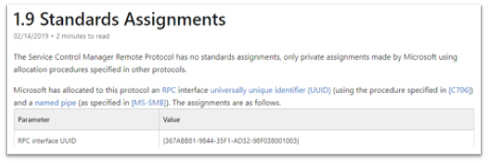
MS-SCMR:
Server Code Identification
Identifying where the RPC Server code is stored is going to be the next step. By identifying this, I know what to monitor for the rest of my testing. To do this I will be using a function inside of NtObjectManager by James Forshaw called “Get-RpcServer”.
PS > Install-Module NtObjectManager
PS > Import-Module NtObjectManager
After the module is installed and imported, I will set the $rpc variable to search across the C:WindowsSystem32\ directory and identify any RPC servers.
PS > $rpc = ls C:\Windows\System32\* |
Get-RpcServer -DbgHelpPath “C:\Tools\WindowsSDK\WindowsKits\10\Debuggers\x64\dbghelp.dll”
The DbgHelpPath flag will pull symbols for method names if they exist. In order to use this flag the WindowsSDK must be installed.
If I wanted to parse RPC Clients as well, I would need to add the -ParseClients flag at the end, like so:
PS > $rpc = ls C:\Windows\System32\\* | Get-RpcServer –ParseClients -DbgHelpPath “C:\Tools\WindowsSDK\WindowsKits\10\Debuggers\x64\dbghelp.dll”
This will store RPC Servers and Clients within the $rpc variable.
Next, I will identify where the Interface UUID is stored, which will give me the file path of the RPC Server.
MS-DRSR:
PS > $rpc | ? {($_.InterfaceId -eq 'e3514235-4b06-11d1-ab04-00c04fc2dcd2')} | Select FilePath
If I wanted to parse clients as well as servers (the second command above), then to show only the RPC Server the command would be this:
PS > $rpc | ? {($_.Client -eq $False) -and ($_.InterfaceId -eq 'e3514235-4b06-11d1-ab04-00c04fc2dcd2')} | Select FilePath
As it can be seen above, the server code that gets exposed to the runtime is ntdsai.dll. These commands have to be ran on the Domain Controller because Domain Controllers are the only systems where ntdsai.dll is stored.
MS-SCMR:
PS > $rpc | ? {($_.InterfaceId -eq '367ABB81-9844-35F1-AD32-98F038001003')} | Select FilePath
As it can be seen above, the server code that gets exposed to the runtime is services.exe.
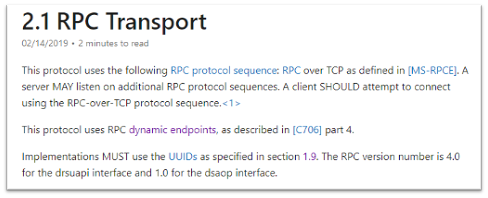
Server Endpoint Identification
Now that I have identified where the RPC Server code is stored, I want to find the endpoints that are used to connect the client to the server via interface. To do this we can explore the Transport on the protocol page. This is stored in different sections on the Protocol page.
MS-DRSR:
Here we can see that the RPC transport for this protocol is done over TCP. There is no static port or named pipe being used, but this is identified at runtime. The Endpoint Mapper will identify the dynamic endpoint that was prescribed to the server when the client request communication.
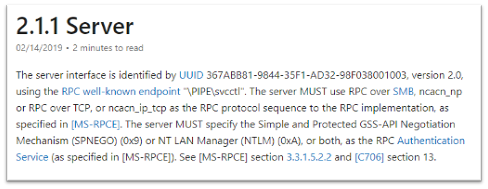
MS-SCMR:
The above might be showing the communication can happen three ways, but reality this interface can be implemented one of two ways:
- A SMB named pipe (PIPEsvcctl)
- TCP
Method Identification
So far, the interfaces that two separate RPC protocols, where the server code is stored for these protocols, and the endpoints that the interfaces use have all been identified. The next thing I want to do is set up the monitoring capabilities needed to see what method calls and verify the endpoints that are utilized when a client initiates a request to perform either a service creation or DCSync. To see this, I will:
- Set up Event Tracing for Windows (ETW) captures on the remote host to see the method and endpoint information.
- Capture ProcMon data on both the local and remote host to show the endpoint and server/client information.
- Utilize Wireshark on the remote host to see the network data surrounding the communications.
The installation of third-party tools will not be demonstrated, nor the capturing process. The captures will be shown to show what the result should look like. The ETW walkthrough can be found in this blog – Utilizing RPC Telemetry.
MS-DRSR:
The DCSync attack was executed via Mimikatz, utilizing a Domain Admin account (Thor). The command looks like the following:
lsadump::dcsync /domain:marvel.local /user:vision
ETW Capture:
Highlights of what this data is identifying:
- RPC server call with the interface UUID of - e3514235-4b06-11d1-ab04-00c04fc2dcd2
- The protocol was TCP
- The Endpoint was 49667
- OpNum (Method) was #3. This correlates to IDL_DRSGetNCChanges. This OpNum can be correlated with the Microsoft Documentation to find its corresponding method:
This context helps verify the information that was read on this protocol’s documentation pertaining the endpoint mapping. One thing to note is that this isn’t a static port. This port can be excluded in the firewall and then the endpoint mapping service will choose another port to talk to the server.
ProcMon Capture:
Client:
This data is fairly straight forward. It is identifying that the client is starting this RPC call, reaching out to the Domain Controller, EARTH-DC, on port 49875. That port then gets mapped to 49667 via Endpoint Mapper service.
I want to see the acceptance of this communication on the server side.
Server:
Above it can be seen that NTDSAI is loaded into LSASS within less than a minute of when the machine was started, meaning the server code associated with the DRSUAPI interface was loaded to the runtime at boot.
Through this testing, I have identified a process that could serve as a pivot in a detection in the future. It is also seen that after LSASS accepts the call, it reads the NTDS.dit file. This is where secrets, such as NTLM password hashes, are stored for the domain. After this is done, the data is sent back over the wire to the client. The next thing to identify and verify, are the methods that were used to obtain those secrets from NTDS.dit.
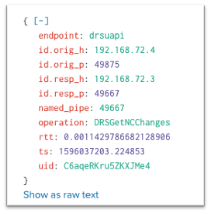
Wireshark Capture:
Highlights from this network capture:
- Source IP/Port.
- Destination IP/Port.
- Protocol that was used for the communication between hosts. This correlates to the interface that was used for the communication because dynamic endpoints are implemented for this protocol.
- Methods that were implemented.
MS-SCMR:
Service Creation was performed via sc.exe, utilizing a Domain Admin account (Thor). Service creation can be done by an Administrator or SYSTEM on a host. This test was conducted against a Domain Controller, hence why a DA account was used. The command looks like the following:
PS > sc.exe \\IP-Address-of-remote-host create test binpath=”C:\Windows\System32\notepad.exe”
ETW Capture:
OpNum 12 – RCreateServiceW:
Highlights of what this data is identifying:
- RPC server call with the interface UUID of - e3514235-4b06-11d1-ab04-00c04fc2dcd2
- The protocol was TCP
- The Port was 49676. ETW didn’t capture the pipe name of the endpoint used (PIPEsvcctl) and transformed the Port to the “Endpoint” section.
- OpNum (Method) was #12. This correlates to RCreateServiceW. This OpNum can be correlated with the Microsoft Documentation to find its corresponding method:
OpNum 15 – ROpenSCManagerW:
Highlights of what this data is identifying:
- RPC server call with the interface UUID of - e3514235-4b06-11d1-ab04-00c04fc2dcd2
- The protocol was TCP
- The Port was 49676 – ETW didn’t capture the pipe name of the endpoint used (PIPEsvcctl) and transformed the Port to the “Endpoint” section.
- OpNum (Method) was #12. This correlates to ROpenSCManagerW. This OpNum can be correlated with the Microsoft Documentation to find its corresponding method:
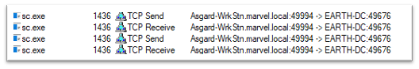
ProcMon Capture:
Client:
This capture is pretty straight forward. This is showing that sc.exe (native Windows binary) is sending TCP data to EARTH-DC via 49994, which the Endpoint Mapper service will redirect to 49676 so that the server will accept the communication.
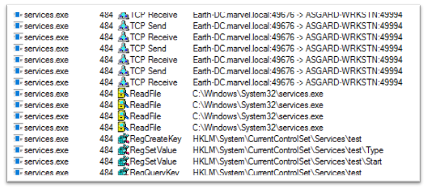
Server:
On the server side I see that services.exe will accept the TCP request on port 49676. Once that is done, you can see that the service “test” was created with the Registry Key – HKLMSystemCurrentControlSetServicestest via RegCreateKey.
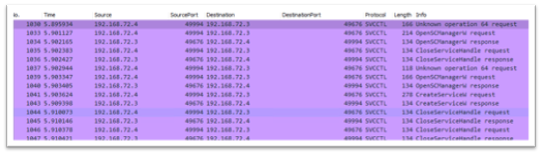
Wireshark Capture:
Highlights from this network capture:
- Source IP/Port
- Destination IP/Port
- Protocol that was used for the communication between hosts. If you go back to the Server Transport page, I can see one of the endpoints was \PIPEsvcctl. This will directly correlate with the Protocol seen here.
- Methods that were implemented
Purpose
The purpose of capturing this data in different ways was to verify each aspect of the RPC communication.
- The client making the request (Found via Procmon).
- The interface it is communicating with (Found via ETW & Wireshark).
- The methods it is implementing (Found via ETW & Wireshark).
- The endpoints that were being mapped to the server (Found via Procmon, ETW, Wireshark).
- The server application that was accepting that communication (Found via Procmon).
The reason why two different use cases were shown, was because I wanted to show how different RPC servers vary with how they work and how they were similar. This was shown with the server code for SCMR being stored in services.exe, where for DRSR was stored in ntdsai.dll. The services.exe binary didn’t have to be loaded by another binary at boot to expose the server code it holds to the Windows Runtime; this was handled within the binary code. Whereas, ntdsai.dll had to be loaded by the lsass.exe binary first before its code was exposed to the Windows Runtime. However, similarities can be seen in how the interfaces, endpoints, and methods are handled.
Now that the research has been verified, I can take this research data and hopefully turn it into telemetry data, which is something I can use for detection/investigation purposes.
Research Data to Telemetry
Converting research data into telemetry can be relatively easy, depending on the data sensors within the environment. What does this mean? It means taking the data attributes I found during testing and converting them to a data sensor that could potentially use within a larger environment at scale.
The data I show below correlates directly to the RPC data shown within the research. I am aware there are multiple detections for these two behaviors, but this will follow a different methodology to see this activity. That isn’t to say past detections are bad, this is just extra visibility that I haven’t seen applied a lot to those previous detection efforts. The objective for this telemetry is - to identify when an RPC server was connected to, to perform an action I know could be malicious.
The data sensors below were used for telemetry testing:
- Windows Security Events
- Zeek
Note:All testing was done inside of a personal hunting lab setup that Ben Shell and I put together calledMarvel-Lab. This lab can be accessed, built out, and used by any user. This project holds all of the necessary components preconfigured and needed to test out this activity.
During the testing process, it was evident that one data sensor that could be used for telemetry was Zeek. Zeek allows insight into the interface being used, the source/destination ports and IP addresses, along with the method that was invoked. Here is a link that holds their DCE RPC configurations:
https://docs.zeek.org/en/current/scripts/base/protocols/dce-rpc/consts.zeek.html
After looking closely, it is clear that I could capture this data simply with this sensor. To verify, I checked within my Splunk instance:
MS-DRSR:
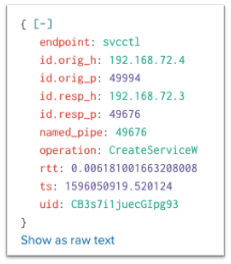
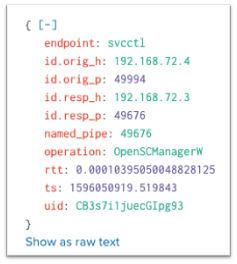
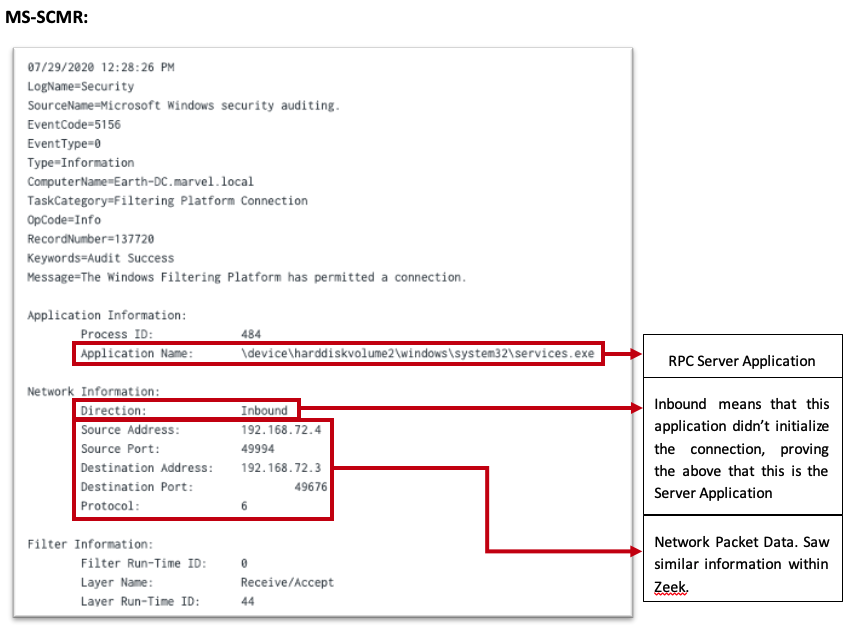
MS-SCMR:
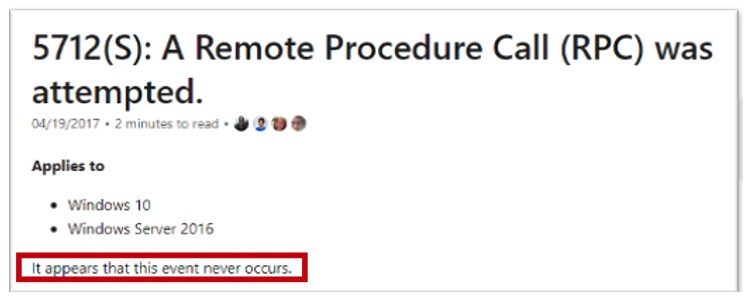
These events show me data to everything, except the RPC server application that accepted the communication. When trying to find this, I ran across Event ID 5712 – A Remote Procedure Call Was Attempted. I tested this event and come to find out, it doesn’t log. It is unclear if this event was logged in the past, but currently the Microsoft Docs say this - “It appears that this event never occurs”:
Meaning that this event isn’t meant to actually capture anything, but where there is a will, there is a way. This goes back to “squeezing” the most out of the data sensors as possible. Even if an event doesn’t directly, or explicitly, correlate with a behavior, one might indirectly, or implicitly. There could be a technology built upon RPC that is being logged, that would give me the visibility needed to see this activity.
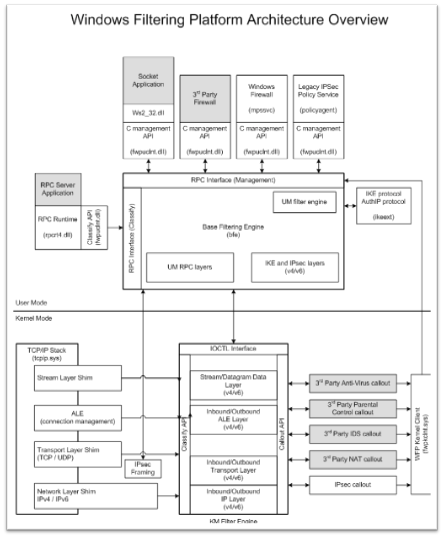
After some more digging, I was able to find an event that seem to generate every time I performed these events. 5156 – The Windows Filtering Platform has permitted a connection. Digging into the architecture, come to find out this technology is a network traffic process platform. I then found this mapping:
Within the “User Mode” section, I can see that this is built upon RPC and that it takes a huge role in this technology. After identifying that, I then saw that the RPC Server Application can be seen. This is exactly what I wanted. I was able to verify:
After identifying this, I tested and was able to make a correlation between these two data events (Windows Security Event 5156 & Zeek). Whichever data attribute one data sensor didn’t provide, the other was able to. This leads to the suspicion that this telemetry could be used at scale. This needed some testing.
Telemetry to Scalability
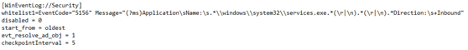
This information would be relatively useless unless there was a way was found to apply this knowledge at scale for Detection efforts. Within various client environments, I was unable to test the scalability of Event Code 5156. This event collects a lot of data and if you are using Splunk, it will eat your indexing limits. Some thoughts on how to apply this event at scale are as follows:
- Identify the RPC Servers you want to start having visibility towards (i.e lsass.exe, services.exe)
-
Inside of the Splunk forwarder, apply this type of inclusions/exclusions that match those servers - https://www.hurricanelabs.com/splunk-tutorials/windows-event-log-filtering-design-in-splunk.
- This would look similar to the following within the inputs.conf if the desire was to monitor for only services.exe (RPC server) for remote service creation –
- When doing this, log for inbound connections as you are looking for the servers accepting the calls.
Note: Some exclusions might need to be applied to the ports/endpoints depending on Microsoft documentation and benign data. Exclusions might need to be applied to IP addresses. – For example, if monitoring lsass.exe for the DRSUAPI interface, exclude DC to DC communication.
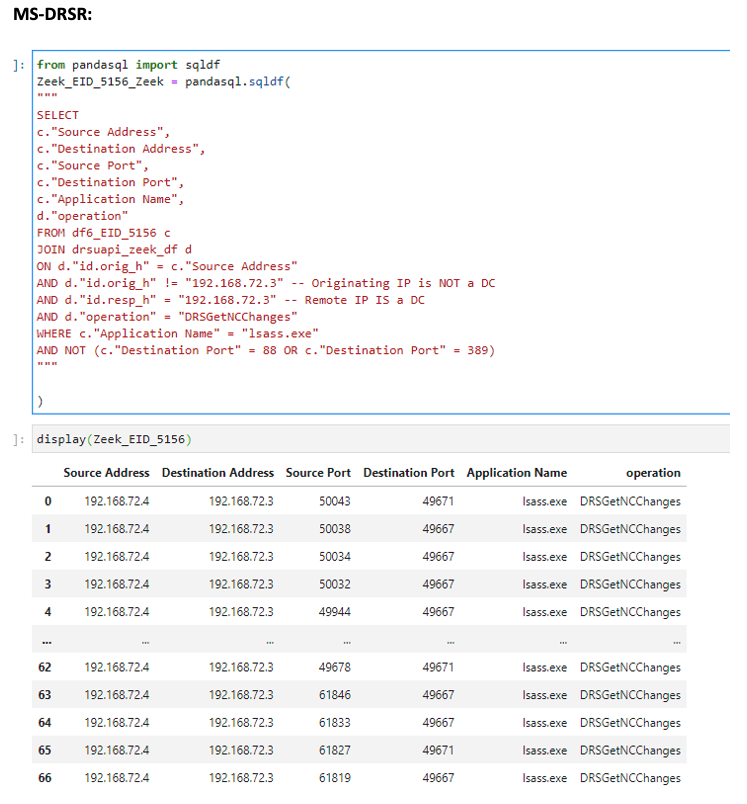
- Collect RPC operation data from a network data source (Zeek for example), JOIN the 5156 to this event via Source/Destination Ports/Addresses, and specify the operation you are interested in. Examples using Jupyter Notebooks can be found below:
More advanced analytics pertaining to these two attacks can be found here -
MS-DRSR: https://github.com/specterops/ipc-research/blob/master/Analytics/DCSync.ipynb
MS-SCMR: https://github.com/specterops/ipc-research/blob/master/Analytics/Remote%20Service%20Creation.ipynb
I was able to identify via Palantir that using available EDR network data, there is similar data to the 5156. This could be used instead at scale JOIN’d with a Network Source to achieve the same goal. Thank you to Dane Stuckey and Palantir for looking into this.
Conclusion
As abstractions for attacks are continued to be created, the detection engineering team here at SpecterOps keep identifying various IPC mechanisms as one of the technologies being used within the attack. One of which that stood out was RPC. Due to the lack of information on the technology and what we thought was lack of data sources pertaining to its technology, I decided to dive into its inner workings to understand it at a deep level behavior.
While researching this topic, I knew that there had to be data that Detection Engineers could use to identify when RPC was used maliciously. In order to find this data understanding how RPC worked and understanding how attackers have and could use it to do their malicious behavior were both key factors. Identifying data sources that can be used to see the RPC server application and the RPC communication both, in research data and data at scale, were two goals that were resolved while doing this research.
Lastly, my hope is that this methodology can be adapted into your research process and its findings be collected as an area of possible telemetry for your environment.
I hope you enjoyed this research!

